
Image Courtesy of Flickr.
It’s in the very air we breathe. Invisible gases, small but pervasive, travel and lodge themselves in our airways as we go through our daily motions. The truth is, the air we breathe is not equitable in its distribution. Harmful pollutants such as nitrogen dioxide (NO2) aggregate in particular communities, leading to severe health disparities and stark gradients in air pollution maps. It has long been known that low-income, urban neighborhoods and communities of color experience significantly worse air pollution than higher-income, majority-white neighborhoods. Sally Pusede’s group from the University of Virginia took this research a step further, conducting a broad survey of the air pollution of the United States and comparing it with various external factors such as days of the week and vehicle pollution in order to locate specific drivers of the disparities.
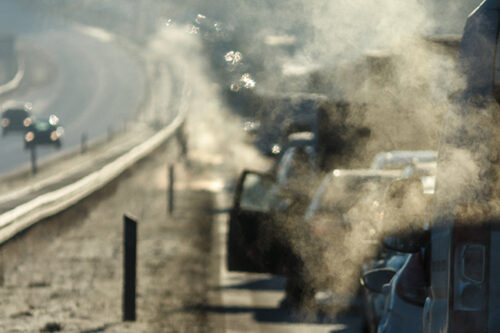
This project combined environmental research with environmental justice policy in hopes of elucidating inter-community disparities. It focused on nitrogen dioxide, NO2, an air pollutant commonly released from road vehicles and fossil fuel combustion reactions. NO2 is also a key factor in atmospheric oxidation and secondary pollution, as it reacts with other chemicals in the air to form pollutants that are not otherwise directly emitted into the atmosphere, such as ozone and acid rain. NO2 has been previously shown to increase levels of respiratory irritation and can lead to hospitalization due to impaired lung function and shortened life expectancy.
The researchers used data from the TROPospheric Ozone Monitoring Instrument (TROPOMI), a satellite launched in 2017 that maps nitrogen dioxide levels almost daily, providing a high degree of clarity for air pollutant emissions at the city-level. “Prior to TROPOMI, the satellite observations [regarding NO2 emissions] were too coarse to look within a city, so you couldn’t go into a city and look at how NO2 is distributed. With these finer scale observations, we can now look at the steep gradients within a city to the point where you can look at a map of NO2 and make out the individual roads,” said Mary Angelique G. Demetillo, a graduate student in Pusede’s group.
With the TROPOMI data, they were able to calculate mean NO2 tropospheric vertical column densities for each 1 x 1 km2 area. Pusede’s group analyzed NO2 data from 2018 to 2020 from fifty-two of the largest cities, stopping right before the start of the pandemic to eliminate any changes in pollution caused by reduced social activity. The cities sampled were “urbanized areas,” so the data reflected intra-urban, rather than suburban-urban, differences. The data was classified by race, ethnicity, and income to compare the air pollution in low-income communities of color to that of high-income, majority-white neighborhoods and to quantify inequalities in terms of NO2 pollution. “All of the data that we used was publicly available, so anyone can use it, and it’s just a question of what’s the best method and how can we integrate all of these types of datasets together. For me, that challenge is pretty exciting,” Demetillo said.
Previous research in this field had already established these existing disparities, but Pusede’s group wanted to look into the drivers of these disparities. In this paper, they compared the data between weekends and weekdays, and cross-referenced this with patterns in diesel truck traffic, allowing them to see what proportion of the atmospheric disparities were due to diesel truck emissions. While diesel trucks make up between three and five percent of vehicles at any given time, they contribute thirty to fifty percent of air pollution from NO2 and many other harmful chemicals and particles.
“People who live in impacted communities have long known that diesel trucks are a major contributor to disparities, but what we contribute here is really sort of the quantification of those [disparities] and the ability to see those [disparities] across cities and in so many cities at the same time,” Pusede said. Data regarding diesel truck emissions was taken from the Fuel-Based Inventory from Vehicle Emissions, which provides information on emission rates and fuel use.
The results of this study indicate that in general, the air pollution in lower-income communities of color is twenty-eight percent higher than that of high-income majority-white neighborhoods. Some of the cities with the highest inequalities were Phoenix, Arizona (where NO2 pollution was forty-six percent higher for lower income communities of color) and Los Angeles, California (where pollution was forty-three percent higher). Regarding diesel truck emissions specifically, air pollution decreases by sixty-two percent on weekends—in part because more vehicles are parked on the weekends. Despite this, disparities still remain, as NO2 pollution in lower-income communities of color only falls by thirty-seven percent.
This study only used data from 2018. “[Over time] broadly speaking, there have been really large gains in air quality across the country, but disparities have persisted throughout this time,” Pusede said.
Just having this data in front of us is not enough. Pusede’s group hopes to influence policymakers with these findings to induce changes that confront and dismantle this inequality. And this work doesn’t just relate to scientists. “For sure it would take interdisciplinary collaboration with people who work with human activity data, urban planning, maybe even historians to assess how the placement of communities and roads has contributed to the current-day air pollution distribution,” Demetillo said. These policies could take the form of identifying specific areas in urban regions that should be more highly regulated for diesel truck traffic.
But even if diesel truck emissions were effectively brought down to zero, there would still be disparities in air pollution from other sources. Thus, moving forward, researchers must investigate other major contributors to air pollution and its unequal distribution, as well as patterns affecting human exposure to it and the causes of these disparities. Human activity data shows us that patterns in activity affect an individual’s exposure to pollution. Meteorology affects the distribution of NO2 within the atmosphere, which also affects our exposure to pollution. Urban planning is a major factor in air quality disparities, as the placement and structuring of communities and roads affects how pollution is distributed.
Closely analyzing satellite data is also key to reducing inequality and lowering air pollution. In this study, since the data was so finely resolved spatially, some temporal data was sacrificed: the researchers used seasonal or annually averaged data. However, they are now looking into daily satellite observations, which could provide more temporal data regarding these disparities that their current analysis could have missed.
Additionally, as NO2 is not distributed homogeneously in the horizontal direction, there will be different levels of exposure to NO2 as you travel across Earth’s surface. However, the satellite data currently used takes an atmospheric cross section that doesn’t account for these horizontal gradients. Looking into them with new satellite data will be yet another important step forward in the future of this research.
“I think an important part of this work is incorporating local communities and local governments into this work. Now that we have a stronger technical grasp on this data, we can better work with those communities to address issues that we might not even know they are experiencing. I think their voices and their perspectives would greatly contribute to this work,” Demetillo said. With more research into atmospheric inequality with collaboration from affected communities, policymakers, and others in the field, we can look forward to concrete changes to alleviate disparities—as well as tackle pollution as a whole.